Almost none of them see the full picture.
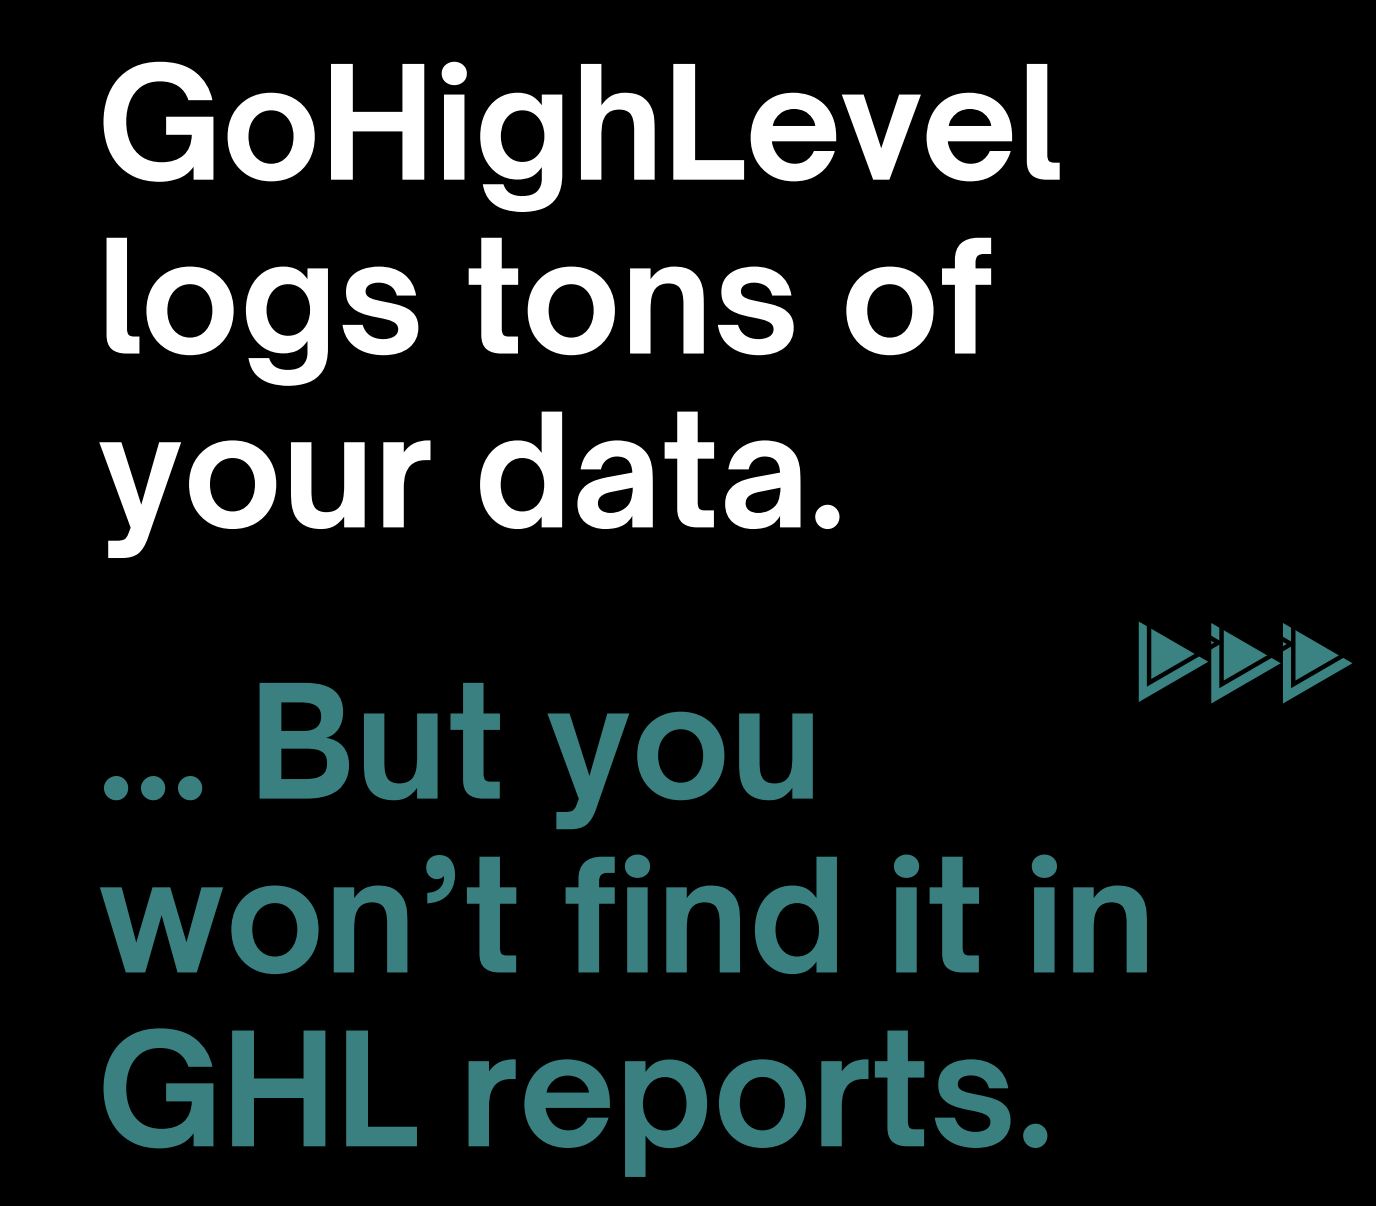
GHL logs everything, but its dashboards show you almost nothing.
Here are three examples hiding in plain sight inside GHL.
Which ones do you wish existed?
1. Sales bottlenecks
Opportunities record every stage change.
But you’ll never see how long deals sit in each stage.
Extract the data to calculate average time-in-stage to find exactly where your pipeline is stuck.
2. No-show rates
Every appointment is tagged “completed,” “cancelled,” or “no-show.”
But the UI won’t tell you what % of scheduled slots are wasted.
Export the data to calculate no-show rate to fix it with reminders or penalties.
3. Revenue clarity
Payments and refunds are logged separately.
But GHL won’t net them.
Export the data to sum successful payments to subtract refunds to You finally have net revenue without manual work.
And that’s just with GHL’s own data.
No extra tools required!
Now imagine when you connect your newly extracted GHL data with your other platforms’ data:
You can measure true campaign ROI by pairing GHL’s leads and conversions with ad spend from Google or TikTok, giving you cost-per-sale clarity.
You can track revenue cohorts by funnel by linking GHL pipelines with Stripe or Recharge, showing which funnels drive the most durable subscription revenue.
And you can evaluate sales rep productivity against customer outcomes by combining GHL activities with CSAT tools, revealing which sales approaches build long-term satisfaction versus short-term churn.
GoHighLevel is a powerful CRM.
But business intelligence happens in your own custom reports.
The difference between “good enough” reporting and growth-driving insights?
Owning your data, not just renting it from a UI.
What’s the one report you wish GHL actually showed you?
We make your GHL data speak fluent ROI.
About the author. Corinna Zennig leads LazyAnalyst, an e-commerce analytics consultancy: ex-Deloitte, 10 years in business and 35+ projects delivered. More about Corinna